This section discusses typical Compare S-Parameters Tool characteristics and displays. Let us know if you would like the Compare S-Parameters Tool enhanced with additional capability.
A typical SerDes channel, with about 18 nsec time delay, defined for use with serial data at a bit rate of 25 Gbps has its hardware 4-Port S-parameters measured from 10 MHz to 40 GHz in steps of 3.125 MHz.
For this example S-Parameter file (SParamFileA), and with all 4 ports selected for measurement with phase unwrapped, the S-Parameter characteristics can be compared to a second S-Parameter file (SParamFileB). In the default example setup, SParamFileB was generated from SParamFileA using the Generate Causal SParameters Tool.
For this example SParamFileA and SParamFileB, the S-Parameter characteristics can displayed in graphs selected to be opened.
Figure 1: Reflection S22 magnitude
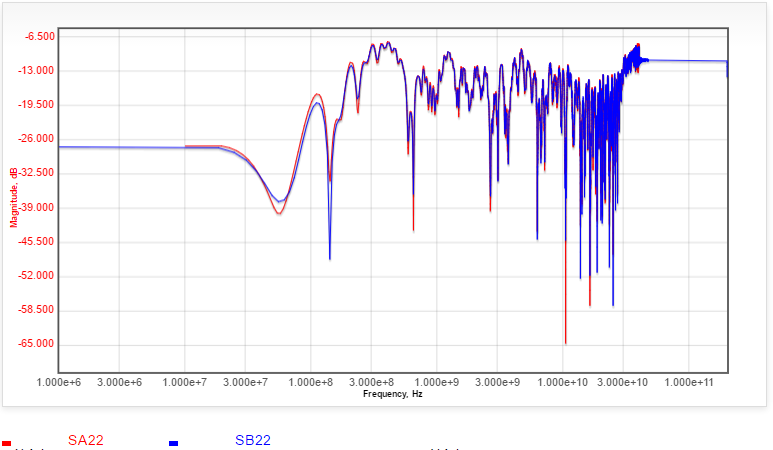
Besides the magnitude response, the phase response can also be viewed. One can zoom in onto any area in the graph.
Figure 2: Transmission S21 magnitude
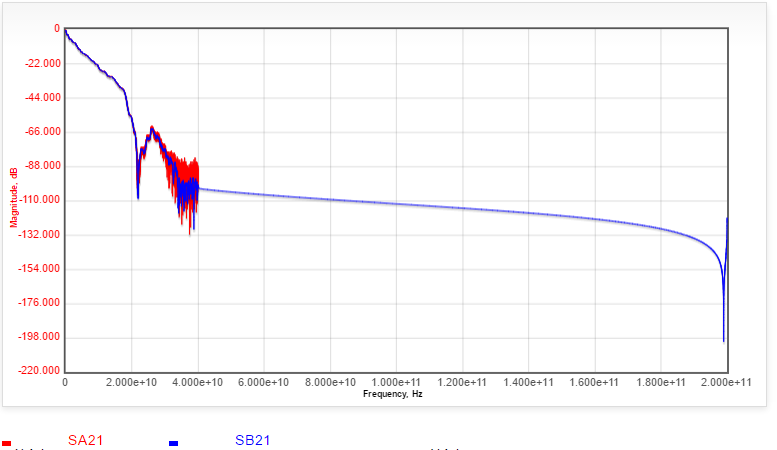
Besides the magnitude response, the phase response can also be viewed. Additionally, the reverse transmission characteristics can be viewed. One can zoom in onto any area in the graph.